Normal AQI depends heavily on where you live and what time of year it is, which is why the same reading can feel routine in one city and alarming in another. The US EPA classifies AQI 0 to 50 as Good and 51 to 100 as Moderate, but the average daily AQI in many US cities sits between 30 and 80, with significant variation by season, geography, and local pollution sources. This guide explains what normal actually means in context and which numbers you should care about regardless of what is typical for your area.
What “Normal” AQI Means in Practice
The word normal gets used two different ways when people talk about AQI, and confusing them leads to poor decisions. Statistical normal means the typical reading for your location based on historical data. Health-based normal means the range the EPA considers acceptable for human health. These two definitions do not always overlap.
A resident of Los Angeles might see AQI readings in the 60 to 90 range on most summer days. That is statistically normal for that city. It is also in the Moderate category, which carries health caveats for sensitive groups. Someone who has just moved from a rural area where readings routinely sit at 20 to 35 might find LA’s typical readings unremarkable because they are common, while someone from that same rural area would recognize those readings as elevated. The EPA’s health categories are absolute thresholds based on air quality science, not relative to local averages. A Moderate reading is Moderate regardless of whether it is typical for your zip code or unusual.
The EPA’s Health-Based AQI Categories
The US EPA sets health thresholds based on PM2.5 and other pollutant concentrations at which measurable health effects begin to occur in specific populations. These categories represent the closest thing to an official definition of what AQI ranges are considered normal versus concerning.
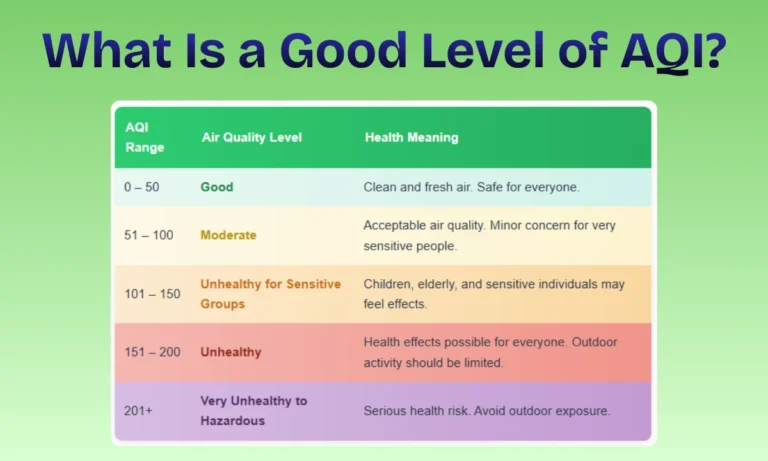
| AQI Range | Category | Health Status |
|---|---|---|
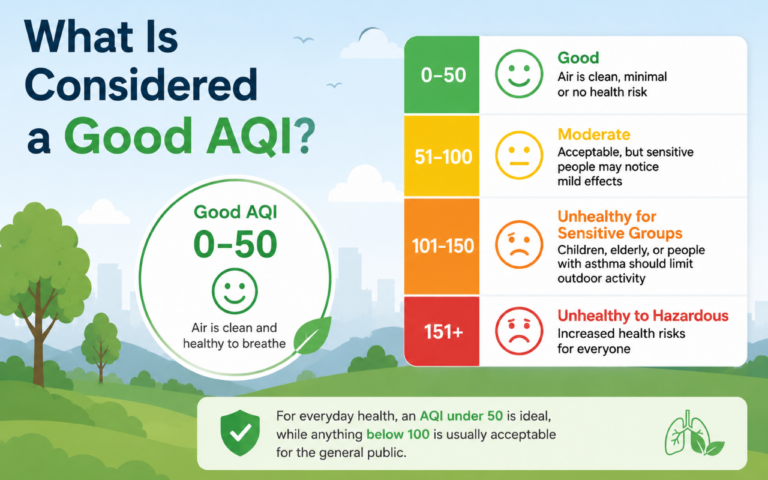
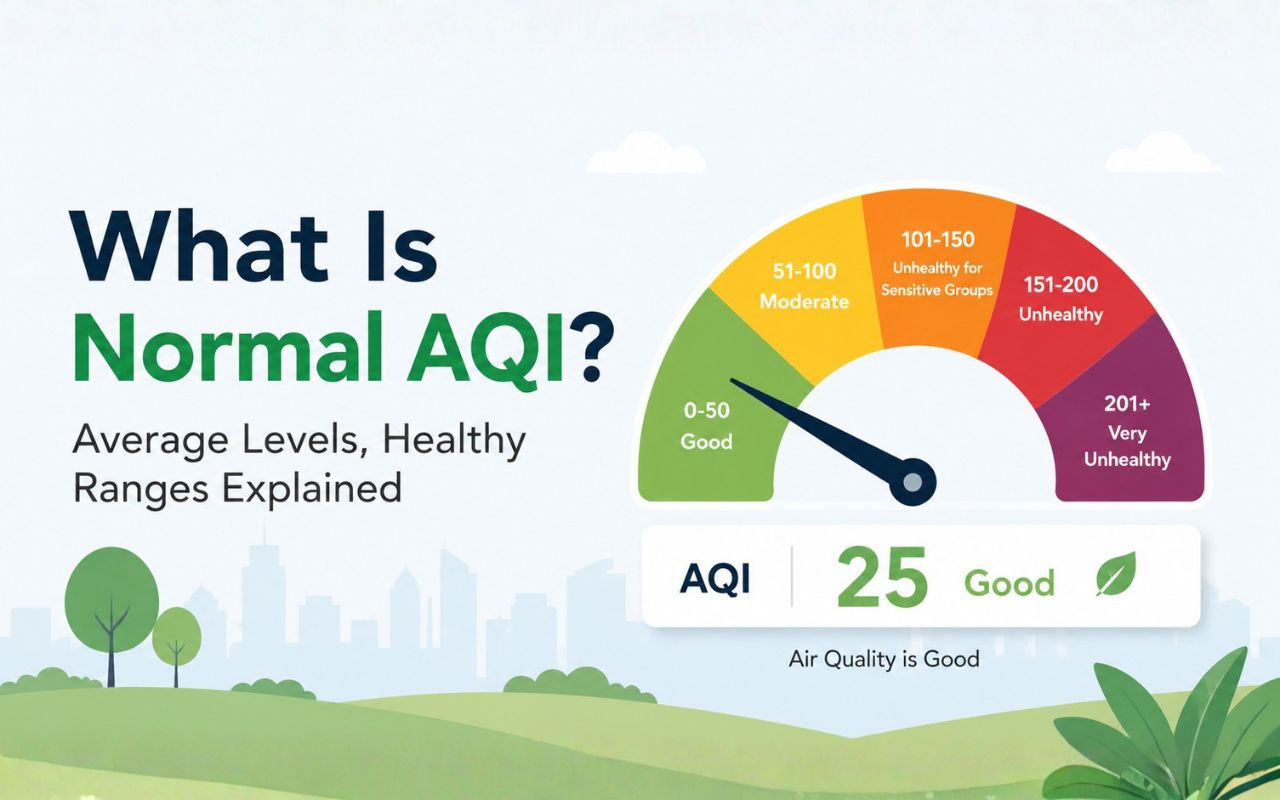
| 0 to 50 | Good | No health risk for any group. Clean air. |
| 51 to 100 | Moderate | Acceptable for most. Sensitive groups may notice minor effects. |
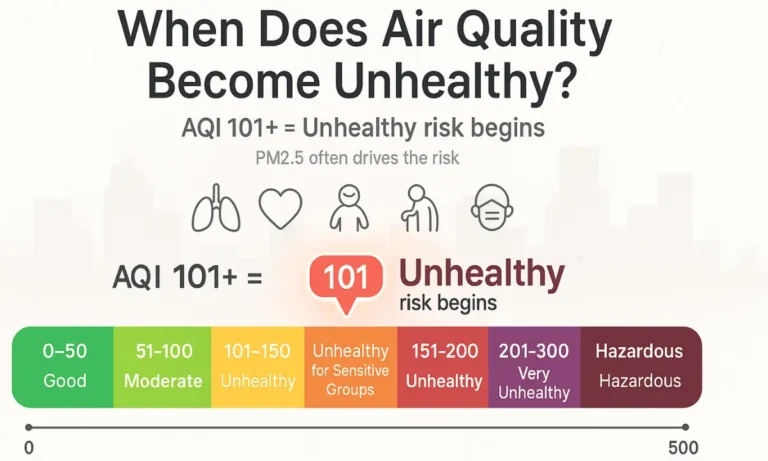
| 101 to 150 | Unhealthy for Sensitive Groups | Children, elderly, and people with asthma or heart disease are at risk. |
| 151 to 200 | Unhealthy | Everyone may begin to experience effects. |
| 201 to 300 | Very Unhealthy | Serious effects for the general population. |
| 301 to 500 | Hazardous | Emergency conditions. Entire population at risk. |
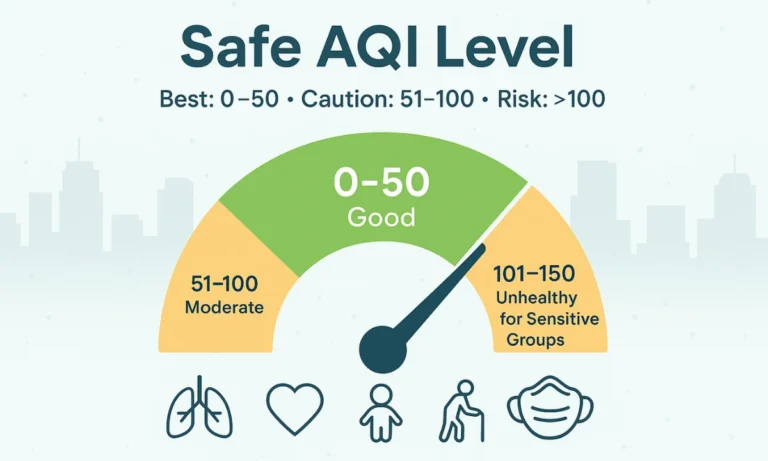
For most people without pre-existing health conditions, anything under 100 is considered within a normal and acceptable range for daily life. The 0 to 50 Good category represents genuinely clean air with no health caveats. The 51 to 100 Moderate category is acceptable for healthy adults but already warrants attention for sensitive groups. Most cities in the US, Canada, Western Europe, and Australia spend the majority of their days somewhere in these two bands.
What Is Considered a Normal AQI by Region and City Type
Statistically typical AQI varies enormously depending on where you are. Understanding the typical range for your region helps you distinguish a genuinely bad day from one that is simply average for your location.
Rural and Suburban Areas with Low Industrial Activity
Rural areas in the US, Canada, Scandinavia, and parts of Australia regularly see daily AQI readings between 10 and 35. These areas represent the lower end of what is possible in populated regions. A reading of 45 in a rural mountain area is already slightly above average and would correspond to light smoke or dust. For people in these areas, AQI above 50 is a meaningful signal worth paying attention to.
Mid-Sized Cities in the US and Western Europe
Cities like Denver, Phoenix, Portland, and most major Western European cities typically see daily AQI readings between 30 and 70 under normal conditions. Seasonal variation is significant: summer ozone season (May through September) pushes readings higher, while winter can bring elevated PM2.5 from heating sources. According to the EPA’s AirData platform, the annual average AQI in US cities with populations between 500,000 and 2 million typically falls between 40 and 65. Days above AQI 100 occur but are not routine in well-monitored, moderately polluted cities.
Major Urban and Industrial Areas
Cities with heavy traffic, industrial activity, or geographic features that trap pollution (Los Angeles sits in a basin; Beijing is surrounded by mountains on three sides) regularly see AQI readings between 60 and 120 during peak periods. In these cities, readings in the 80 to 100 range feel routine but they still represent air quality that the EPA considers at the boundary of what is acceptable. People who live in these cities often normalize readings that would trigger concern in lower-pollution areas, which is one reason air quality health literacy matters regardless of where you live.
High-Pollution Cities in South and Southeast Asia
Delhi, Lahore, Dhaka, and several other South Asian cities regularly record AQI readings between 150 and 300 during winter months and above 200 during high-pollution events. The World Health Organization’s annual air quality database consistently lists these cities among the highest PM2.5 averages globally. For residents of these cities, a reading of 100 can feel like a relatively clean day by comparison, even though it falls in the Unhealthy for Sensitive Groups category by any international standard.
What Drives AQI Up and Down Day to Day
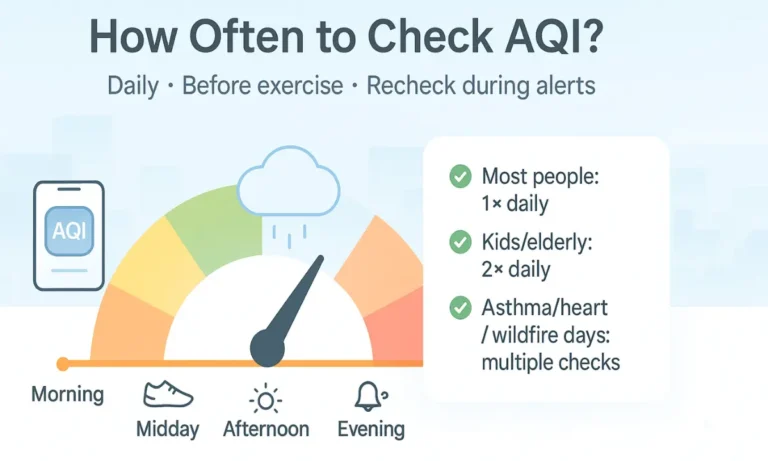
AQI is not static. It fluctuates by hour, day, and season based on a predictable set of factors. Understanding these patterns helps you anticipate when your local AQI is likely to be at its best and worst.
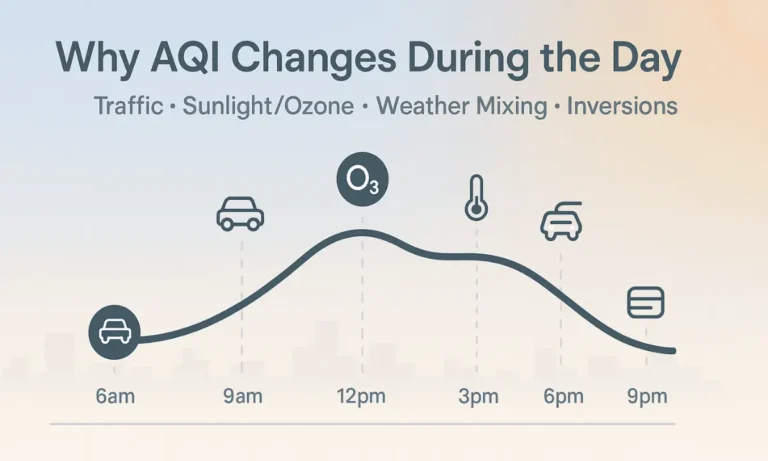
- Traffic and commute hours: Ground-level PM2.5 and nitrogen dioxide peak during the 7am to 9am and 4pm to 7pm windows in cities with significant car traffic. AQI in urban areas is frequently 15 to 30 points higher during these windows than in the early morning or late evening.
- Temperature and sunlight: Ground-level ozone forms when sunlight reacts with nitrogen oxides and volatile organic compounds. Hot, sunny, and low-wind days in summer produce the highest ozone readings. This is why AQI in many cities is measurably worse in summer afternoons than on cool overcast days.
- Wind and rain: Wind disperses pollutants and reduces local AQI. Rain scrubs particles from the air. Days following rain and overnight clearing are typically the cleanest of any given week. AQI readings of 10 to 25 in a city that usually averages 55 are often the result of overnight rain and morning wind.
- Wildfire smoke: Wildfires can push AQI from 40 to 200 within hours across regions hundreds of miles from the fire itself. Smoke events are increasingly common in western North America and parts of Australia, and they represent the largest single source of extreme AQI events in otherwise clean-air regions.
- Seasonal burning and agricultural activity: Agricultural burning in Southeast Asia (February through April), Saharan dust events affecting Southern Europe (spring and early summer), and crop burning in South Asia (October and November) create predictable annual AQI spikes tied to agricultural calendars rather than industrial emissions.
How to Tell If Your Local AQI Is Better or Worse Than Average
Your weather app shows today’s AQI but not whether it is better or worse than your city’s historical baseline. Two tools give you that context quickly.
AirNow.gov shows hourly readings for the current day but also links to the EPA’s AirData system, which provides historical annual summaries and trend data for thousands of US monitoring sites. Searching your county or city in AirData shows the number of days per year in each AQI category, the annual average, and how those figures have changed over the past decade. IQAir’s website publishes annual city and country rankings based on average PM2.5 concentration, updated each year with data from thousands of monitoring stations globally. These two sources together give you a baseline against which to judge whether today’s reading is routine or genuinely unusual for your location. See what is considered a good AQI for a full breakdown of the EPA scale and what each number means for health decisions.
Normal AQI vs Acceptable AQI: Why the Difference Matters
The most important practical distinction is between what is statistically common in your area and what is actually safe for your health. These two things are not the same, and many people use the word normal when they mean familiar.
A city where AQI 80 is a typical summer day has not made AQI 80 safe for people with asthma. It has simply made it common. The EPA’s Moderate category (51 to 100) carries the same health caveats for sensitive groups regardless of whether it represents the daily norm for a city of 10 million or an unusual spike in a rural county. Getting comfortable with the health categories as absolute thresholds, rather than evaluating readings relative to local baselines, leads to better decisions about outdoor activity, ventilation, and when sensitive family members need extra precautions. For guidance specific to children, elderly adults, and people with chronic conditions, see AQI safety for sensitive groups.
Conclusion
A normal AQI in the health-based sense falls between 0 and 100, with 0 to 50 representing clean air and 51 to 100 representing acceptable air for most healthy adults. What is statistically normal varies by city, season, and local pollution sources, and it does not change the health thresholds those readings represent. The most useful habit is treating the EPA’s categories as fixed reference points rather than adjusting your interpretation based on what is common where you live.
Frequently Asked Questions
What is a normal AQI reading?
A normal AQI reading in health terms is anything under 100. The EPA’s Good category (0 to 50) represents clean air safe for everyone. The Moderate category (51 to 100) is acceptable for most healthy adults. Statistically typical readings vary by location, ranging from 10 to 35 in rural areas to 60 to 90 in mid-sized urban centers under ordinary conditions.
Is AQI 50 normal?
AQI 50 sits at the top of the Good category and is considered clean, healthy air with no risk for any population group. It is a normal and desirable reading. In rural and low-pollution suburban areas it is common. In major cities it often represents a particularly clean day following rain or strong overnight winds.
What is the average AQI in US cities?
According to EPA AirData historical records, most US cities with populations above 250,000 have annual average AQI readings between 40 and 70. Cities in the western US, particularly in California’s Central Valley and the Los Angeles basin, tend toward the higher end of that range due to geography and traffic volume. Smaller cities and suburban areas with less industrial activity typically average between 25 and 50.
Is AQI 100 bad?
AQI 100 is at the boundary between Moderate and Unhealthy for Sensitive Groups. For healthy adults, it is still within the acceptable range for normal daily activity, though prolonged vigorous outdoor exercise should be shortened. For children, elderly adults, and people with asthma, COPD, or cardiovascular disease, AQI 100 is the practical threshold to start reducing outdoor exertion and keeping windows closed.
Why does AQI vary so much throughout the day?
AQI is recalculated hourly and reflects real-time pollutant concentrations that shift with traffic, temperature, wind, and sunlight. Traffic peaks push PM2.5 and nitrogen dioxide up during commute hours. Ground-level ozone builds through the morning and peaks in early afternoon on sunny days. Rain and wind clear particles and lower readings quickly. A city’s morning AQI can be 30 points lower than its midday reading on a typical summer weekday.